Debug
- Click on Code > Debug from the menu. This will open the script debug dialog.
- Click on
chooseto select the debug target - On the left-hand side, select the debug script type. The available script types depend on the support for the 'JDK'. Generally, they include
Groovy/JavaScript/General. - The script will automatically execute after a 3-second pause while typing and the results will be displayed below.
- The plug-in provides tools and context, which can be accessed through tools.
By default, the selected context for debugging is 'class'. If you need to debug a different context, you can reassign 'it' in the script header. For example, to debug a 'method', use the following script
//Switch Context, now 'it' is the first method in the class
it = it.methods()[0]
//Now you can try to write a script with 'method'
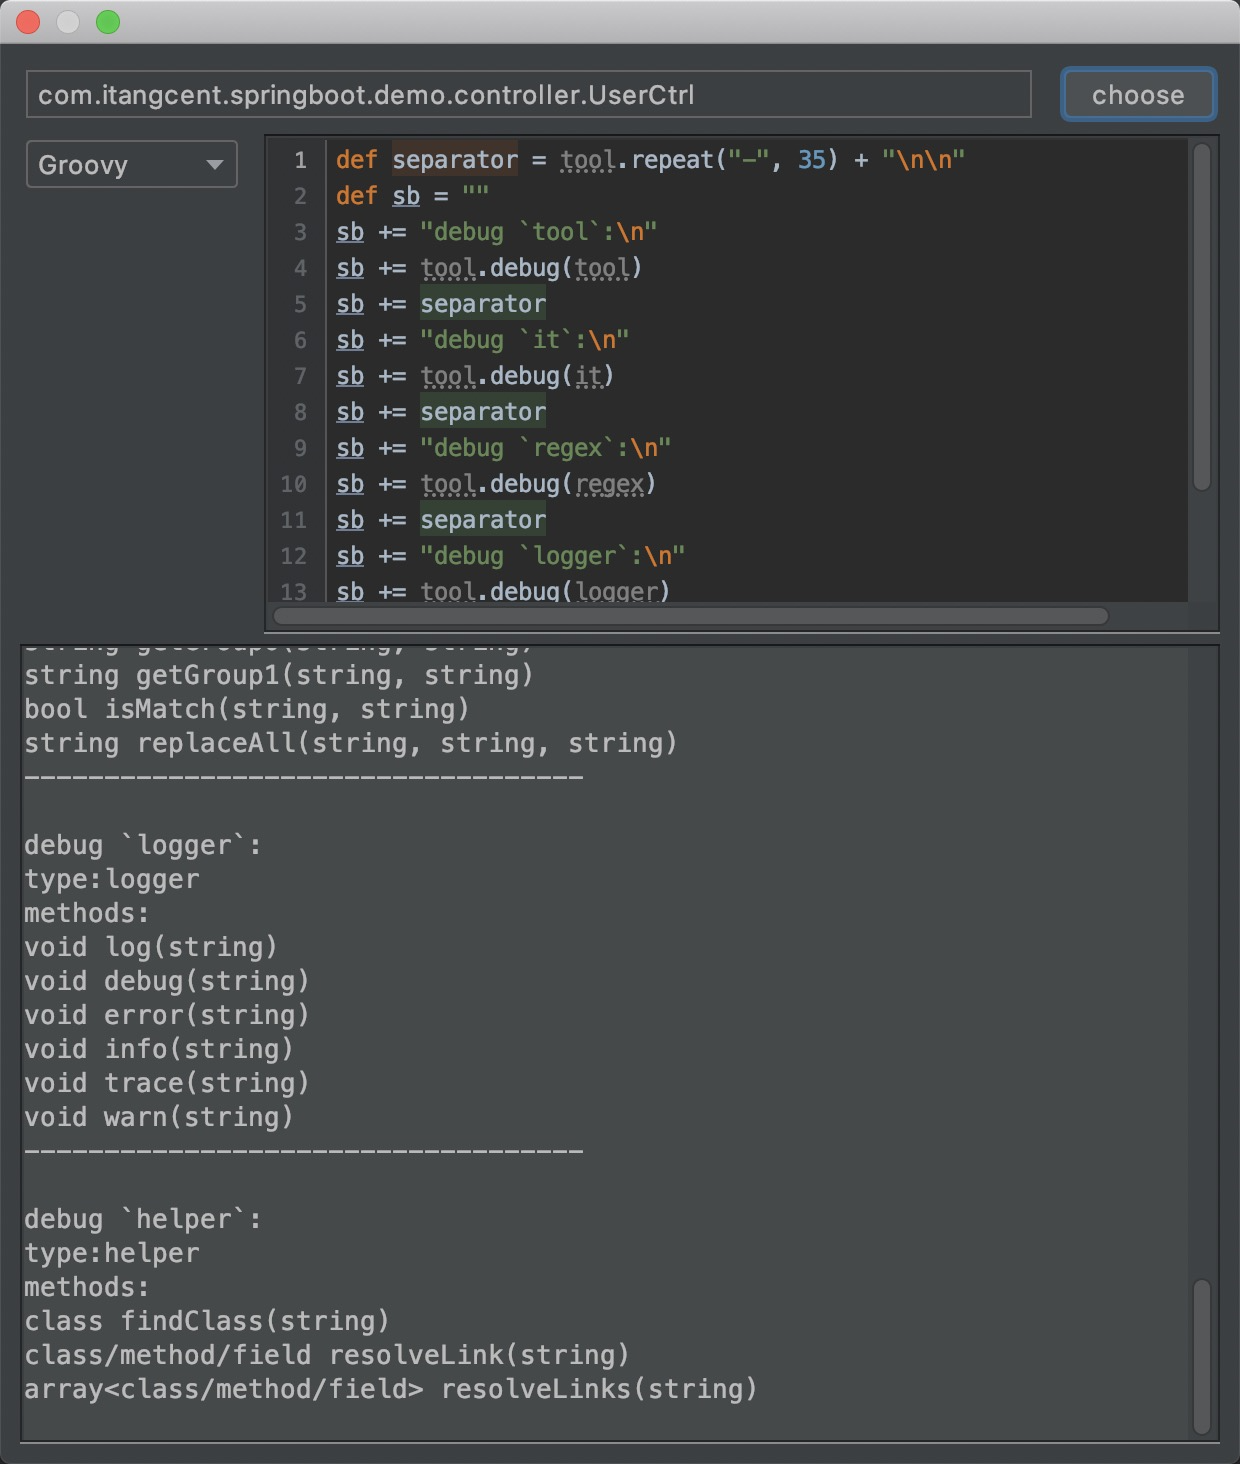
def separator = tool.repeat("-", 35) + "\n\n"
def sb = ""
sb += "debug `tool`:\n"
sb += tool.debug(tool)
sb += separator
sb += "debug `it`:\n"
sb += tool.debug(it)